1976 proposed by Peter Chen.
What are the fundamentals required for understanding and designing ER diagrams?
How ER modeling is performed?
The basic concepts involved in ER diagrams are as follows:
Type of Attributes

• Entities with the same basic attributes are grouped or typed into an entity type.
• In ER diagrams, an entity type is displayed in a rectangular box

• Each entity type will have a collection of entities stored in the database

• Based on the requirements, we can identify four initial entity types in the COMPANY database:
• By examining the requirements, six relationship types are identified

• In the refined design, some attributes from the initial entity types are refined into relationships:
• An relationship type whose with the same participating entity type in distinct roles
• An entity that does not have a key attribute
• Constraints on Relationship Types
Displaying a recursive relationship

Attributes of Relationship types

• Cardinality ratio (of a binary relationship): 1:1, 1:N, N:1, or M:N


Objectives
What are ER Model?
What are the fundamentals required for understanding and designing ER diagrams?
How ER modeling is performed?
What are ER Model?
- Entity – Relationship model (ER model) in software engineering is an abstract way to describe a database.
- Relational database, stores data in tables. Some of the data’s(entities) in these tables point to data’s(entities) in other tables. Diagrams created to design these entities and relationships are called entity–relationship diagrams or ER diagrams.
ER diagram is widely used in database design
- Represent conceptual level of a database system
Describe things and their relationships in high level
What are the fundamentals required for understanding and designing ER diagrams?
The basic concepts involved in ER diagrams are as follows:
1) Entities (and their entity types and entity sets): Entities are specific objects or things in the mini-world that are represented in the database.
E.g. the EMPLOYEE John Smith, the Research DEPARTMENT, the ProductX PROJECT etc.
2) Attributes(simple, composite, multivalued):
• Attributes are properties used to describe an entity.
e.g. an EMPLOYEE entity may have the attributes Name, SSN, Address, Sex, BirthDate
• A specific entity will have a value for each of its attributes.
• Each attribute has a value set (or data type) associated with it – e.g. integer, string etc.
3) Relationships(and their relationship types and relationship sets):
• It relates two or more distinct entities with a specific meaning.
E.g. EMPLOYEE John Smith works on the ProductX
• Relationships of the same type are grouped or typed into a relationship type.
e.g. , the WORKS_ON relationship type in which EMPLOYEEs and PROJECTs participate.
• The degree of a relationship type is the number of participating entity types.
e.g. WORKS_ON is a binary relationships
Concepts in details with examples.
Type of Attributes
• Simple
o Each entity has a single atomic value for the attribute. For example, SSN or Sex.
• Composite
o The attribute may be composed of several components. For example:
Address(Apt#, House#, Street, City, State, ZipCode, Country), or
Name(FirstName, MiddleName, LastName).
Composition may form a hierarchy where some components are themselves composite.
• Multi-valued
o An entity may have multiple values for that attribute. For example, Color of a CAR or PreviousDegrees of a STUDENT.
Denoted as {Color} or {PreviousDegrees}.
In general, composite and multi-valued attributes may be nested arbitrarily to any number of levels, although this is rare.
Entity Types and Key Attributes
• Entities with the same basic attributes are grouped or typed into an entity type.
o For example, the entity type EMPLOYEE and PROJECT.
• An attribute of an entity type for which each entity must have a unique value is called a key attribute of the entity type.
o For example, SSN of EMPLOYEE.
• A key attribute may be composite.
o VehicleTagNumber is a key of the CAR entity type with components (Number, State).
• An entity type may have more than one key.
o The CAR entity type may have two keys:
o VehicleIdentificationNumber (popularly called VIN)
o VehicleTagNumber (Number, State), aka license plate number.
• Each key is underlined.
Displaying an Entity type
• In ER diagrams, an entity type is displayed in a rectangular box
• Attributes are displayed in ovals
o Each attribute is connected to its entity type
o Components of a composite attribute are connected to the oval representing the composite attribute
o Each key attribute is underlined
o Multivalued attributes displayed in double ovals
For example a CAR entity can be shown as below:
Entity Set
• Each entity type will have a collection of entities stored in the database
o Called the entity set
• Below example shows three CAR entity instances in the entity set for CAR.
• Same name (CAR) used to refer to both the entity type and the entity set
• Entity set is the current state of the entities of that type that are stored in the database
Case Study: COMPANY Database Schema.
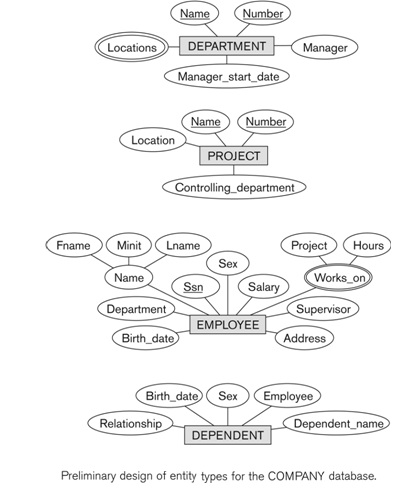
• Based on the requirements, we can identify four initial entity types in the COMPANY database:
o DEPARTMENT
o PROJECT
o EMPLOYEE
o DEPENDENT
Their initial design is shown as below (Note: The initial attributes shown are derived from the requirements description)
Relationship type vs. relationship set
• Relationship Type:
o Is the schema description of a relationship
o Identifies the relationship name and the participating entity types
o Also identifies certain relationship constraints
• Relationship Set:
o The current set of relationship instances represented in the database
o The current state of a relationship type
Relationship instances of the WORKS_FOR N:1 relationship between EMPLOYEE and DEPARTMENT

Relationship instances of the WORKS_FOR M:N relationship between EMPLOYEE and DEPARTMENT

• Previous figures displayed the relationship sets
• Each instance in the set relates individual participating entities – one from each participating entity type
• In ER diagrams, we represent the relationship type as follows:
o Diamond-shaped box is used to display a relationship type
o Connected to the participating entity types via straight lines
o Is the schema description of a relationship
o Identifies the relationship name and the participating entity types
o Also identifies certain relationship constraints
• Relationship Set:
o The current set of relationship instances represented in the database
o The current state of a relationship type
Relationship instances of the WORKS_FOR M:N relationship between EMPLOYEE and DEPARTMENT
• Each instance in the set relates individual participating entities – one from each participating entity type
• In ER diagrams, we represent the relationship type as follows:
o Diamond-shaped box is used to display a relationship type
o Connected to the participating entity types via straight lines
Refining the COMPANY database schema by introducing relationships
• By examining the requirements, six relationship types are identified
• All are binary relationships( degree 2)
• Listed below with their participating entity types:
o WORKS_FOR (between EMPLOYEE, DEPARTMENT)
o MANAGES (also between EMPLOYEE, DEPARTMENT)
o CONTROLS (between DEPARTMENT, PROJECT)
o WORKS_ON (between EMPLOYEE, PROJECT)
o SUPERVISION (between EMPLOYEE (as subordinate), EMPLOYEE (as supervisor))
o DEPENDENTS_OF (between EMPLOYEE, DEPENDENT)
ER DIAGRAM – Relationship Types are:
WORKS_FOR, MANAGES, WORKS_ON, CONTROLS, SUPERVISION, DEPENDENTS_OF
Discussion on Relationship Types
• In the refined design, some attributes from the initial entity types are refined into relationships:
o Manager of DEPARTMENT -> MANAGES
o Works_on of EMPLOYEE -> WORKS_ON
o Department of EMPLOYEE -> WORKS_FOR
• In general, more than one relationship type can exist between the same participating entity types
o MANAGES and WORKS_FOR are distinct relationship types between EMPLOYEE and DEPARTMENT
o Different meanings and different relationship instances.
Recursive Relationship Type
• An relationship type whose with the same participating entity type in distinct roles
• Example: the SUPERVISION relationship
• EMPLOYEE participates twice in two distinct roles:
o supervisor (or boss) role
o supervisee (or subordinate) role
• Each relationship instance relates two distinct EMPLOYEE entities:
o One employee in supervisor role
o One employee in supervisee role
Weak Entity Types
• An entity that does not have a key attribute
• A weak entity must participate in an identifying relationship type with an owner or identifying entity type
• Entities are identified by the combination of:
o A partial key of the weak entity type
o The particular entity they are related to in the identifying entity type
• Example:
o A DEPENDENT entity is identified by the dependent’s first name, and the specific EMPLOYEE with whom the dependent is related
o Name of DEPENDENT is the partial key
o DEPENDENT is a weak entity type o EMPLOYEE is its identifying entity type via the identifying relationship type DEPENDENT_OF
Constraints on Relationships
• Constraints on Relationship Types
o (Also known as ratio constraints)
o Cardinality Ratio (specifies maximum participation)
One-to-one (1:1)
One-to-many (1:N) or Many-to-one (N:1)
Many-to-many (M:N)
o Existence Dependency Constraint (specifies minimum participation) (also called participation constraint)
zero (optional participation, not existence-dependent)
one or more (mandatory participation, existence-dependent)
Displaying a recursive relationship
• In a recursive relationship type.
o Both participations are same entity type in different roles.
o For example, SUPERVISION relationships between EMPLOYEE (in role of supervisor or boss) and (another) EMPLOYEE (in role of subordinate or worker).
• In following figure, first role participation labeled with 1 and second role participation labeled with 2.
• In ER diagram, need to display role names to distinguish participations.
Attributes of Relationship types
• A relationship type can have attributes:
o For example, HoursPerWeek of WORKS_ON
o Its value for each relationship instance describes the number of hours per week that an EMPLOYEE works on a PROJECT.
A value of HoursPerWeek depends on a particular (employee, project) combination
o Most relationship attributes are used with M:N relationships
In 1:N relationships, they can be transferred to the entity type on the N-side of the relationship
Example Attribute of a Relationship Type: Hours of WORKS_ON
Notation for Constraints on Relationships
• Cardinality ratio (of a binary relationship): 1:1, 1:N, N:1, or M:N
o Shown by placing appropriate numbers on the relationship edges.
• Participation constraint (on each participating entity type): total (called existence dependency) or partial.
o Total shown by double line, partial by single line.
• NOTE: These are easy to specify for Binary Relationship Types.
Relationships of Higher Degree
• Relationship types of degree 2 are called binary
• Relationship types of degree 3 are called ternary and of degree n are called n-ary
• In general, an n-ary relationship is not equivalent to n binary relationships
• Constraints are harder to specify for higher-degree relationships (n > 2) than for binary relationships
Summary of notation for ER diagrams
Data Modeling Tools
• A number of popular tools that cover conceptual modeling and mapping into relational schema design.
o Examples: ERWin, S- Designer (Enterprise Application Suite), ER- Studio, etc.
• POSITIVES:
o Serves as documentation of application requirements, easy user interface - mostly graphics editor support
• NEGATIVES: o Most tools lack a proper distinct notation for relationships with relationship attributes
o Mostly represent a relational design in a diagrammatic form rather than a conceptual ER-based design
Some of the Currently Available Automated Database Design Tools